Infra-red satellite animation from EUMETSAT showing a series of storms which have affected the United Kingdom and Ireland over the past two weeks.
Climate Change...10/02/2014  Is climate change to blame for recent UK storms and flooding? It is natural, with the scale of the impacts of recent stormy weather that this question is asked, and there are three aspects that need to be considered. The first relates to the impact of sea level rise on coastal flooding; the second relates to storminess (i.e. the number and/or strength of the storms); and the third relates to rainfall. For rainfall this refers not only to seasonal or monthly means, but also to the intensity and frequency of daily, and even hourly, heavy rain events. Sea level along the English Channel has already risen by about 12cm in the last 100 years. With the warming we are already committed to over the next few decades, a further 11-16cm of sea level rise is likely by 2030. This equates to 23-27cm of total sea level rise since 1900. We are very confident that sea level will continue to rise over coming decades as the planet continues to warm. These numbers represent our current best estimate for the UK. Recently, Dr Ken Collins from Ocean and Earth Science discussed how climate change in the English Channel was creating new fast-moving ecosystems. In seeking to answer questions about the impact of climate change on severe weather, there are two distinct steps to be taken. The first is to detect a change in either the frequency or intensity of storminess or rainfall events that is more than just the natural variability in UK weather. UK weather is notoriously volatile and so detection is particularly challenging. Severe storms have always affected the UK and are documented in many historical records. The intensity of recent storms is unusual, as the climatological records discussed earlier indicate, but not necessarily unprecedented. A comprehensive study of trends in storminess, for the period 1871-2010 from an ensemble of reanalyses provides some important insights. They show a robust signal of increasing numbers of strong winter cyclones and with increasing intensity for the high latitude North Atlantic, covering the region to the north of the UK and including Iceland. This is associated with a reduction in storminess further south and supports a wide body of evidence for a poleward shift of the Atlantic storm track. However, their analysis of changes in storminess further south over the mid-latitude North Atlantic – the path of the recent storms – suggests a more complex signal. Although the number of strong winter cyclones has not increased since 1871, the mean intensity has. Notably, for very strong cyclones, the mean intensity has increased significantly. A more comprehensive study of storms affecting the UK is needed to explore these findings in more detail, but the current evidence does suggest an increase in storminess. The persistence of the recent storminess is unusual, and although clustering of storms is quite common, the continued run of deep depressions, through December, January and on into February, is not. It is this continued run of storms that has created the exceptional flooding conditions experienced in the Somerset Levels, for example. The persistence of the weather patterns affecting both the UK and also the US, where abnormally cold conditions have continued to affect the eastern and southern states through January, has raised questions about whether the jet stream is making greater excursions, north and south, and whether these waves in the jet stream are becoming more locked in one position. This is a critical question because it raises the possibility that disruption of our usual weather patterns may be how climate change may manifest itself. The Met Office is now actively researching the best way to detect changes in the dynamics of the jet stream. Beyond the clustering of storms there is also the question of whether there is a detectable change in the amount of rain that the storms are carrying. Again this is a very difficult area because UK rainfall is highly variable in space and time. Changes in monthly, seasonal or annual mean amounts are difficult to detect so far. However, there is now some emerging evidence that, over the UK, daily heavy rain events may be more frequent. What in the 1960s and 1970s might have been a 1 in 125 day event is now more likely to be a 1 in 85 day event. This supports other evidence that UK rainfall is increasing in intensity. This increase in the frequency/intensity of extreme daily rainfall events, as the planet warms and the atmosphere can hold more water, has been discussed in the literature for a number of years, and robust evidence for this is increasingly seen around the world. Furthermore, where there are sufficiently long records of hourly rainfall data, it has been shown that rain rates potentially increase with temperature at rates that exceed the simple thermodynamic Clausius-Clapeyron relationship (6-7% increase in humidity for 10C rise in temperature) between temperature and humidity. This can be understood through the dynamic amplification of rain-bearing systems, where the induced circulation drives greater convergence of moisture into the system and hence heavier rainfall. A detailed study of UK stations with long hourly rainfall records is urgently needed to corroborate this evidence. Following on from the issues of detecting changes in storminess and rainfall discussed above, the process of then attributing even some aspects of those changes to anthropogenic climate change remains challenging. Attribution is fundamental to making the case for climate change. It is already able to provide robust and statistically significant statements about global and even continental temperature change. The attribution of changes in mean rainfall, regional climate and weather extremes is much more challenging. The attribution method depends fundamentally on climate models in order to separate out the effects of human-induced climate change from natural variability. Basically the models are used as a laboratory to perform the experiment of what the climate would have been like without anthropogenic greenhouse gases. By comparing model simulations with and without anthropogenic greenhouse gases it is possible to identify where changes in the climate can only be reproduced when the effects of anthropogenic greenhouse gas increases are invoked. For this comparison to be reliable and to provide a robust evidence-base for decision-making, it is essential that the models are fit for the purpose. It is for this reason that model evaluation is a critical part of the IPCC process. In terms of the global temperature record, climate models are able to simulate the evolution of the observed record since 1860 with considerable skill and the difference between the simulations with and without anthropogenic greenhouse gases is statistically significant. It is this result that enabled the IPCC to state that ‘It is extremely likely (95-100% certain) that human activities caused more than half of the observed increase in global mean surface temperature from 1951 to 2010.’ It follows that to perform climate change attribution of the recent storminess and heavy rainfall requires a climate modeling system that is able to simulate these weather systems and their potential drivers. A limitation until recently has been model resolution (horizontal and vertical). It is only now that the climate models are reaching a level of detail and skill that is necessary to address the issues raised by recent events. This was demonstrated in a seminal paper on the attribution of extreme events by US and UK scientists in 2013. Over the last 3 years there have been major advances in Met Office capabilities in simulating weather and climate variability; for example, the climate model (HadGEM3) is now able to simulate the frequency of atmospheric blocking in the Atlantic that agrees with observations. These advances have come primarily through increased horizontal resolution (from typically 150km in the atmosphere and 10 in the ocean, to 60km and 1/40 respectively) and increased vertical resolution (from 38 levels in the atmosphere and 40 levels in the ocean, to 85 levels and 75 levels respectively). This has facilitated substantial progress to be made in simulating and understanding the processes that determine the natural variability of the climate system (such as the North Atlantic Oscillation (NAO) and El Nino/La Nina and its global influences), and its response to factors such as solar variability and declining Arctic sea ice. With a credible modeling system in place it should now be possible to perform scientifically robust assessments of changes in storminess, the degree to which they are related to natural variability and the degree to which there is a contribution from human-induced climate change. These studies are a high priority, although they are very computationally-intensive and require simulation of many decades of the climate to ensure a statistically significant result. Extreme daily/hourly rainfall remains much more challenging because of the local nature of these events. However, recent advances in modeling at the kilometre scale for UK weather forecasting have opened up new opportunities. This model (UKV) with a grid scale of 1.5km has delivered a step change in simulating the morphology of rainfall events, with intensity and duration statistics that agree with radar observations. The utility of the UKV model to deliver climate change impacts, related to extreme rainfall at the local and regional scale, is already being explored and the results are very promising. This forms part of the Met Office long-term strategy to deliver an integrated approach to risk-based assessments of hazardous weather at the regional and local level, on all timescales, from hours to decades. So what can be said about rainfall in the meantime? There is an increasing body of evidence that shows that extreme daily rainfall rates are becoming more intense, and that the rate of increase is consistent with what is expected from fundamental physics. Although formal attribution is still challenging, it is possible to identify a contribution from climate change for some major flooding events. It is worth emphasizing that there is no evidence to counter the basic premise that a warmer world will lead to more intense daily and hourly heavy rain events. In terms of the impacts of changing weather and climate patterns, the cluster of drought and flood events through the early years of the 21st century and the recent runoff and recharge patterns, are near to the extreme range of historical variability. They therefore also raise the question that they may reflect anthropogenic climate change. It is important to note, however, that differing flood types may be expected to respond differently to increasing temperatures and the affects on agricultural claims. Tidal flood risk is increasing as sea levels rise but the outlook is more complex in relation to fluvial flooding. Published studies have observed increased river flows in the winter half-year and a tendency for higher flows to occur more frequently, and this has been reinforced in recent years. Importantly, however, such a trend may not be accompanied by any increase in magnitude of major flood events. In the UK, no positive trend in water-year maxima was found in the 130-year series for the Thames. Enhanced groundwater flood risk may be expected if average winter rainfall in the UK increases. Flash flooding, which can be exacerbated by land management and land use practices (particularly the extension of impermeable areas), may also increase if the recent intensification in rainfall translates into an enduring trend. In terms of the storms and floods of winter 2013/2014, it is not possible, yet, to give a definitive answer on whether climate change has been a contributor or not. The climatological context discussed earlier was unusual, with the Atlantic jet stream being more intense and reaching further back into the tropical East Pacific than normal. Those factors in themselves would allow warmer and moister air to enter the storm systems. It is also the case that the sub-tropical Atlantic is now warmer than it was several decades ago and that too would act to enhance the moisture content of the storms. More weather research is urgently needed to deliver robust detection of changes in storminess and daily/hourly rain rates. The attribution of these changes to anthropogenic global warming requires climate models of sufficient resolution to capture storms and their associated rainfall. Such models are now becoming available and should be deployed as soon as possible to provide a solid evidence base for future investments in flood and coastal defences. Record Breaking Flooding...10/02/2014  London's River Thames burst it's banks on 10th February 2014 following heavy rainfall The exceptional run of severe winter storms which carried with them large amounts of rain led to very serious flooding across southern England. With catchments across most of the UK saturated by mid-December, the full gamut of flood manifestations – tidal, pluvial (flash), fluvial and groundwater – were experienced over the ensuing seven to eight weeks. Initially, the focus was on tidal flooding. In the first week of December, eastern and southern England experienced their highest storm surge since the extensive tidal flooding in January 1953. The flooding, whilst extensive, was considerably less than the 1953 event (1953: 307 deaths, 24,000 properties and 65,000 hectares compared with 2013: 0 flood related deaths, 1,400 properties and 6,800 hectares) due to the warning, response and flood defences put in place by the Environment Agency and others since 1953. The damage and associated insurance claim validation was moderate in comparison to that major disaster, but substantial evacuations were required (e.g. in Boston, Lincolnshire) and the ingress of seawater damaged a number of important wetlands (e.g. Blakeney, Norfolk). High tides, exacerbated by intense low pressure systems and frequent strong south-westerly winds, continued to contribute to coastal and estuarine flood risk well into 2014. Thereafter, the second half of December and early January witnessed a succession of very deep cyclonic systems. Particularly influential in the hydrological context was the system which brought notable rainfall totals (>30 mm, with some exceptionally high totals in western uplands) to many areas on the 23rd/24th December. This triggered flash flooding, particularly in south-west England, and a steep increase in river flows across most of the UK. Estimated outflows from Great Britain remained close to the highest ever recorded during late December and, subsequently, throughout most of January across large parts of England and Wales. Relative to the average, runoff rates were generally most outstanding across southern and central England and the singular nature of this episode is well illustrated by flow patterns on the Thames. In a series from 1883, flows at Kingston (close to the tidal limit) remained above 275 m3 s-1 for longer than in any previous flood episode , and continue to exceed this threshold into early February. Correspondingly, floodplain inundations were extensive and protracted, owing to the succession of low pressure systems producing rainfall over saturated ground. A preliminary analysis suggest that outflows aggregated over six weeks were the greatest since the 1947 floods – the most extensive in England and Wales during the 20th century. In December and January, a few rivers (including the Mole, Wey and Medway, which, on the basis of preliminary data, recorded their highest flows since the extreme floods of September 1968) registered outstanding maximum flows. However, generally, the peak flows registered during the recent flooding were not extreme. On the Thames the highest flow in 2014 has been exceeded during 14 earlier floods (most prior to 1950.) The floodplain inundations caused major disruption to transport, agriculture and restricted sporting and recreational activities, and resulted in severe difficulties for some low-lying hamlets (most notably in the Somerset Levels). However, given the overall volume of runoff, the amount of property flooding at the national scale was relatively modest. Groundwater levels were generally below the seasonal average at the end of the autumn in 2013, but as infiltration rates increased markedly through December, the recovery in groundwater levels was dramatic in many aquifer outcrop areas – the southern Chalk in particular. At Tilshead, on Salisbury Plain, levels rose by 20 metres in around a fortnight and the well was artesian by late January. In Sussex the Chilgrove House well was also overflowing – there have been around six similar artesian episodes in a record extending back to 1836. As a consequence, examples of groundwater flooding, first noted in mid-December (e.g. in Dorset and Hampshire), became increasingly common in vulnerable areas (e.g. South Downs and Berkshire Downs) with an expectation that more widespread flooding will occur as groundwater levels rise in the slower-responding aquifers (e.g. the Chilterns). Soils are likely to remain close to saturation into the early spring, continuing the risk of floodplain inundations in response to even moderate amounts of rainfall. The lagged response of groundwater levels to the persistent rainfall is likely to contribute to further flooding in vulnerable aquifer areas of southern England. Record Breaking Weather...10/02/2014 Throughout December, January and February 2013/14, the UK has been affected by an exceptional run of severe winter storms, culminating in the coastal damage and widespread flooding from January onwards. The impacts on individuals, businesses and infrastructure have been substantial. This blog post explores the weather datasets of these storms, how unusual they were in the terms of past records, and considers the global context in which these storms formed. Finally the question of whether the intensity of these storms, and their impacts on flooding, has been influenced by climate change will be considered. During December widespread high wind speeds were recorded across UK, as a sequence of deep lows tracked across or to the north of the country. The storm on 4th-5th December generated a major North Sea storm surge event, which coincided with one of the highest tides of the year and threatened much of the east coast in a similar manner to the 1953 event. With improved coastal defences built by the Environment Agency and accurate early warnings several days in advance major damage was avoided. The Environment Agency Thames Barrier was raised to protect London from the largest tide recorded at Southend since it became operational. A measure of the extent and severity of the December storms can be seen in the number of stations from the observational network that recorded maximum gust speeds greater than 50, 60, or 70 Knots (excluding stations with an altitude >=250m and four exposed offshore sites). For each of the thresholds the number of high wind gusts in December 2013 is higher than for any other December back to 1969, and is one of the windiest calendar months for the UK since January 1993. The stormy weather continued into January with a major storm on 5th and 6th January, which caused widespread coastal damage and flooding in southern England. With a brief respite in January the stormy weather returned with the first week of February seeing a sequence of very deep depressions running into the UK with very high winds and storm surges that caused substantial damage along the south coast. The exceptional duration of the stormy weather and the clustering of deep depressions has been a notable feature of this winter. Rainfall records were broken in both December and January). Scotland had its wettest December since records began in 1910. In southern England, January was the wettest recorded since 1910, and the statistics suggest that this was one of, if not the most, exceptional periods for winter rainfall across England and Wales in at least 248 years. The two-month total (December + January) of 372.2mm for the southeast and central southern England region is the wettest of any 2-month period in the series from 1910. 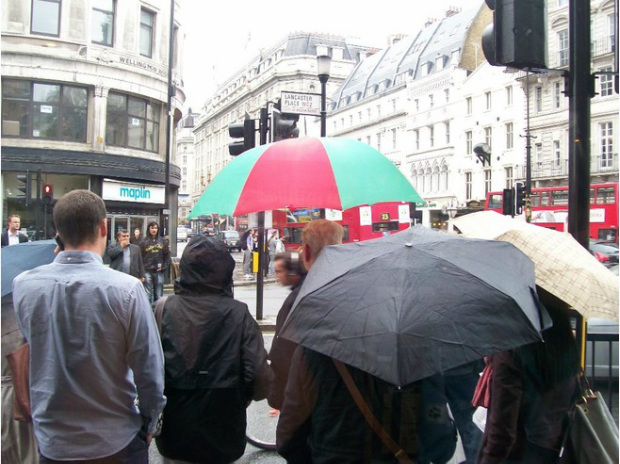 Commuters shelter from the heavy rain in Central London A particularly exceptional aspect of January 2014 has been the number of days with rain across southern England, which far exceeded anything previously recorded for January. Overall there have been very few dry days since 12th December. This continuous sequence of rain events led to increasing saturation of the ground so that widespread flooding became inevitable when the major storm of 5th and 6th January arrived over the UK. The Thames, in particular, recorded some of the highest flow rates ever measured at this time of year. In January 2014, the Environment Agency Thames Barrier was raised on 13 consecutive times to protect people and property as high fluvial flows and high spring tides coincided. Rainfall continued to be well above average through January, giving little respite for areas already affected by flooding especially in southern England, and notably Somerset. As already noted this winter has been exceptionally stormy. A particularly intense depression passed to the north of UK on 24th December with Stornaway recording a mean sea level pressure of 936mb. Pressures below 950mb for UK land stations are relatively rare, and this is the lowest such value at a UK land station for many years. Based on analysis, it is potentially the lowest land station pressure record since 1886. This storm led to widespread disruption to travel, construction delay and the loss of power to hundreds of thousands of homes over the Christmas period. This sequence of storms continued into January 2014, with a deep depression forming over the North Atlantic on 5th January. A notable feature of this storm was the size of the depression, which affected the whole North Atlantic. Storms of such size and intensity are rare. This meant that the fetch and strength of the winds built up a huge swell with some of highest recorded wave heights reaching the shores of Western Europe. The west coasts of the UK were severely affected by the storm surge and the exceptionally high waves resulting in extensive damage to sea defences. Rainfall associated with this system also caused extensive flooding in areas already saturated by the wet weather in the preceding months. Throughout the development of the storm that affected the UK on 5th, 6th and 7th January, the Met Office ocean and wave forecast models were giving very useful guidance. On the global scale, significant wave heights in excess of 16m were predicted to the south west of the UK, consistent with other estimates of wave heights exceeding 15m (50ft). Higher resolution forecasts using the UK 4km model showed that these waves would reach UK shores as a strong, very long period swell. Consequently, each wave carried a lot of energy and was able to inflict significant damage on coastal infrastructure. Storms generating waves of this height are not particularly unusual for the northeast Atlantic, but several factors mark out the event on 6th and 7th January. The track of the storm fell at a relatively low latitude for an event of this type, pushing the bulk of the wave energy towards the southwest of Ireland and England. Peak wave periods were exceptionally long (even compared with storms of similar wave height occurring in December), and enhanced the impact of the waves at the coastline. The combination of significant wave height and peak period is likely to mark out the storm as a one in 5-10 year event in the southwest of the UK, based on experience of waves over the last 30 years. In terms of the coastal system as a whole, pre-existing river and groundwater levels plus impact on coastal sediment levels of a sequence of highly energetic wave events during December may make this is a far rarer event. 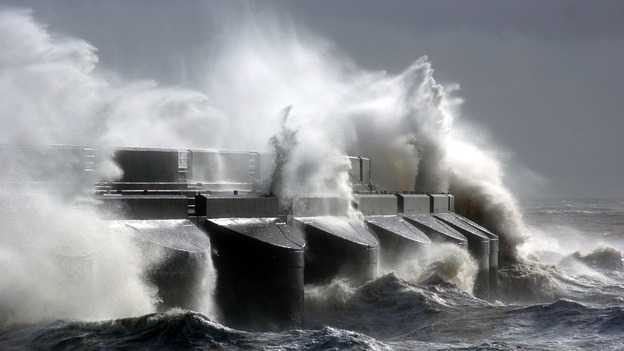 Large waves batter the South-West coast of England With sea defences already weakened the storms that affected southern England on 4th and 5th February, and expected for 7th and 8th February, have caused serious localised damage to infrastructure. The strength the waves, driven onshore by the very strong winds, and the consequent height of the storm surge produced very dangerous conditions along southern coasts. The heavy rainfall that accompanied these systems also led to worsening conditions in areas already affected by prolonged flooding. Introduction...10/02/2014 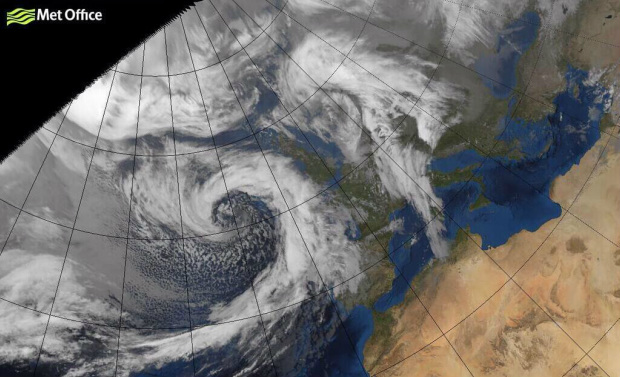 Infra-Red satellite image showing an Atlantic storm making landfall over the UK Although no individual storm can be regarded as exceptional, the clustering and persistence of the storms is highly unusual. December and January were exceptionally wet. For England and Wales this was one of, if not the most, exceptional periods of winter rainfall in at least 248 years. The two-month total (December + January) of 372.2mm for the southeast and central southern England region is the wettest any 2-month period in the series from 1910. During January and into February the tracks of the storms fell at a relatively low latitude, giving severe gales along the south and west coasts and pushing the bulk of the ocean wave energy toward the southwest of Ireland and England. Peak wave periods were exceptionally long; each wave carried a lot of energy and was able to inflict significant damage on coastal infrastructure. In a series from 1883, flow rates on the River Thames remained exceptionally high for longer than in any previous flood episode. Correspondingly, floodplain inundations were extensive and protracted. The severe weather in the UK coincided with exceptionally cold weather in Canada and the USA. These extreme weather events on both sides of the Atlantic were linked to a persistent pattern of perturbations to the jet stream over the Pacific Ocean and North America. There is a strong association with the stormy weather experienced in the UK during December and January and the up-stream perturbations to the jet stream over North America and the North Pacific. The major changes in the Pacific jet stream were driven by a persistent pattern of enhanced rainfall over Indonesia and the tropical West Pacific associated with higher than normal ocean temperatures in that region. The North Atlantic Jet Stream has also been unusually strong; this can be linked to an unusually strong westerly phase of the stratospheric Quasi-Biennial Oscillation (QBO), which in turn has driven a very deep polar vortex and strong polar night jet. As yet, there is no definitive answer on the possible contribution of climate change to the recent storminess, rainfall amounts and the consequent flooding. This is in part due to the highly variable nature of UK weather and climate. Recent studies suggest an increase in the intensity of Atlantic storms that take a more southerly track, typical of this winter’s extreme weather. Also the long-term warming of the sub-tropical Atlantic will also act to enhance the amount of moisture being carried by storms that take this more southerly track. There is an increasing body of evidence that extreme daily rainfall rates are becoming more intense, and that the rate of increase is consistent with what is expected from fundamental physics. There is no evidence to counter the basic premise that a warmer world will lead to more intense daily and hourly heavy rain events. More historical weather observations are urgently needed to deliver robust detection of changes in storminess and daily/hourly rain rates. The attribution of these changes to anthropogenic global warming requires climate models of sufficient resolution to capture storms and their associated rainfall. Such models are now becoming available and should be deployed as soon as possible to provide a solid evidence base for future investments in flood and coastal defences. UK Storms and Floods (Winter 2013/14)...10/02/2014 During winter 2013/14, the UK has been affected very severely by an exceptional run of winter storms, culminating in serious coastal damage and widespread, persistent flooding. This period of weather has been part of major perturbations to the Pacific and North Atlantic jet streams driven, in part, by persistent rainfall over Indonesia and the tropical West Pacific. The North Atlantic Jet Stream has also been unusually strong; this can be linked to exceptional wind patterns in the stratosphere with a very intense polar vortex. This historical weather blog documents the record-breaking weather and flooding, considers the potential drivers and discusses whether climate change contributed to the severity of the weather and its impacts. 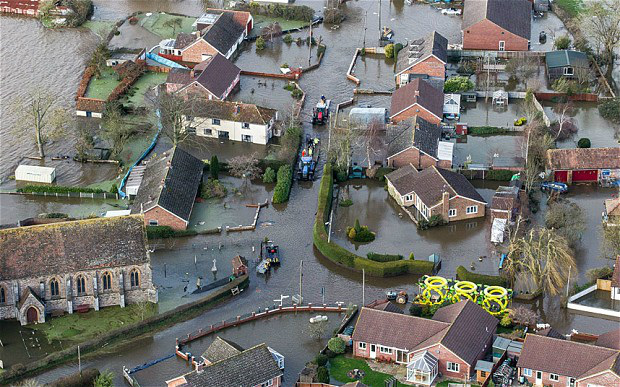 The village of Moorland, Somerset, was completely flooded throughout January and February | Author© Crown Copyright 2014 ArchivesCategories |
 RSS Feed